The monitoring of the Network component of the GISELA e- infrastructure has been performed by WP5, using the perfSONAR middleware which enables to measure and display different parameters like: bandwidth, jitter, delay for every link in a multi domain networks. For this purpose WP5 has deployed monitoring points in several Resource Centers, as shown in Table 1.
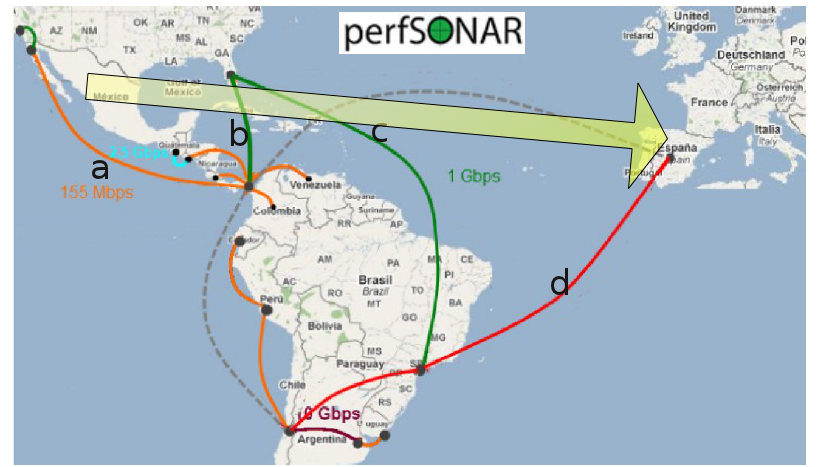
Table 1. Measurement Points installed in GISELA project
|
Coutry |
Institution |
FQDN |
IP Address |
|
Brazil |
Universidade Federal de Rio de Janeiro (UFRJ) |
||
|
Colombia |
Universidad Industrial de Santander (UIS) |
||
|
Ecuador |
Consorcio Ecuatoriano para el Desarrollo de Internet Avanzado (CEDIA) |
- |
|
|
Panamá |
Universidad Tecnológica de Panamá (UTP) |
||
|
Venezuela |
Universidad de Los Andes (ULA) |
Ticket System
To manage any network problem and attend any network provision request a ticket system has been installed. It can be reached using the link https://giselart.cecalc.ula.ve
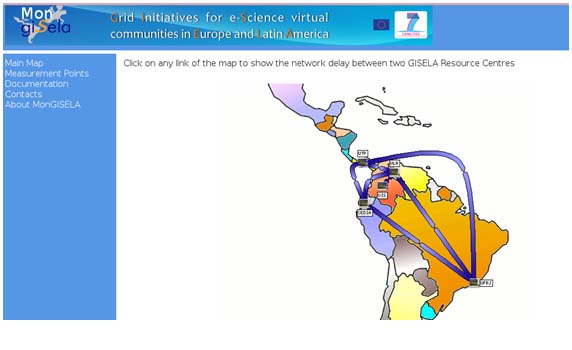
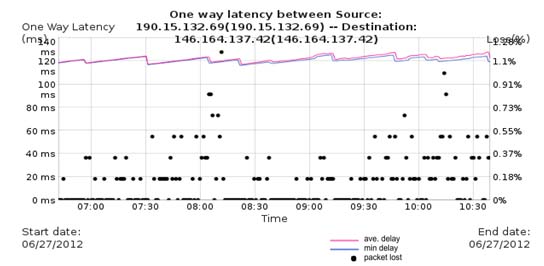
From MonGISELA, one can easily obtain real-time graphs of packet losses percentage and delay between RCs. The graph below shows the minimum and average delay (blue and red lines, respectively) and the packets lost percentage (black dots) between the UFRJ and CEDIA RCs on June, 27 2012.
Administration Procedures
The procedures to administrate the monitoring platform are described in the following document:
GISELA Network Resource Provision Operation Manual
Updated by Philippe Gavillet (July 2012)